Mapping Science
Maps help us navigate by simplifying complex landscapes and highlighting the important structures therein. The best maps convey a great deal of relevant information while minimizing the bandwidth needed to communication by suppressing extraneous detail; the best maps efficiently compress of complex data. In our study of science, the terrain that we wish to map is the lattice of interrelated scientifc publications, linked first and foremost by scholarly citations. We have developed a suite of network analytic tools which, when coupled with data visualization techniques, allow us to map our the intellectual structure of science.
Featured Projects
Mapping Science
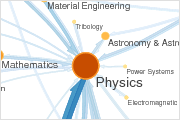
We developed the map equation (often known as the infoMap algorithm) in order to uncover the modular structure of large weighted directed graphs. An extension of the method reveals the hierarchical structure of large networks. Applying the map equation to citation data from the Thomson-Reuters Journal Citation Reports, we have created a number of visualizations to illustrate the flow of ideas among scientific fields.
Well-Formed Eigenfactor
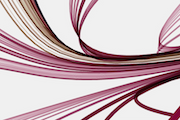
Well-Formed Eigenfactor is an collaborative experiment in visualizing citation patterns among scholarly journals based on data from the Thomson-Reueters Journal Citation Reports. Moritz Stefaner, in collaboration with the Eigenfactor team, drew upon the Eigenfactor® metrics and the map equation approach to develop four novel interactive visualizations to illustrate the structure of science.