Scholarly Publishing
The Eigenfactor project began as an effort to quantify the value provided by academic journals, and this remains a core component of our mission. We consider citations to be the primary indicator of scholarly impact, and use network methods to improve upon simple citation counts as a way of quantifying influnence.
Featured Projects

Eigenfactor Journal Ranking
The Eigenfactor® Metrics — Eigenfactor® Score and Article Influence® Score — have become an industry standard in journal evaluation. These metrics use information from the entire citation network to measure the importance of each journal, much as Google's PageRank algorithm measures the importance of websites on the world wide web. Free of charge, our journal ranking site provides the Eigenfactor metrics for every journal in the Thomson-Reuters Journal Citation Reports since 1996.
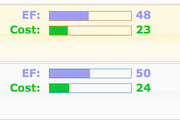
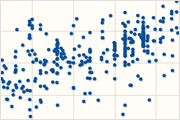
Cost-Effectiveness of Journal Subscriptions
Our studies of journal prices have revealed startling differences between the subscription prices charged by for-profit publishers and those charged by non-profit publishers. Our cost effectiveness tool for subscription-based journals reports subscription prices and sorts journals in order of value per dollar.
Cost-Effectiveness of Open Access Journals
Open access journals vary dramatically in the value-per-dollar that they offer to authors. Our open access tool provides a way for researchers to assess the value that they are getting in exchange for the article processing fees that different journals demand.
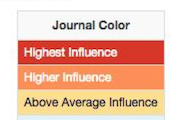
Eigenfactorizer Browser Plug-in
The Eigenfactorizer is a plug-in for the Chrome browser that color-codes search results from Pubmed searchers according to the Article Influence of the journal in which they appear. This provides additional information about journal impact to supplement a literature search.
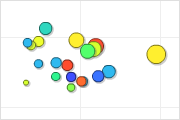
Eigenfactor Motion Graphs
Our Eigenfactor motion graphs allow users to explore changes in the publication landscape from 1997 to 2008. Gapminder-style animated visualizations track variables including Eigenfactor score, Article Influence, journal price, self citation rate, and articles published as they change over time.